

When something goes wrong in a production environment, there are no breakpoints, no debugger and no way to step through code interactively and inspect state. The only evidence available is what the system was deliberately built to record. Observability means leaving a clear, queryable trace of what a system did, in what order and why, so that issues can be diagnosed without needing to reproduce them locally.
Logging is the foundation of that trace. However, having logs is not the same as having useful logs. This article covers how to write application logs that support diagnosis, how to query them effectively using examples from Azure Application Insights and what to avoid.
What makes a log message useful?
The most common logging mistake is only recording that something went wrong. A log that says "command failed" tells an engineer very little. Useful logs record what happened at each stage of a process.
Log entry points, exit points, and branching conditions
The three most valuable places to add a log statement are: when a process starts, when it ends and when it reaches a decision point. Entry logs confirm that a path was entered at all. Exit logs confirm what the outcome was. Branching logs - placed before the condition is evaluated, not inside each branch - record the state that determined which path was taken.
A log that only exists inside a successful branch will be entirely absent if the process takes an unexpected route. Without a log before the condition, there is no way to know whether the branch was ever reached.
Include identifiers, not just messages
Consistently including a relevant entity identifier such as a payment or user ID in log messages pays off over time. It becomes possible to search that identifier across the entire log history and reconstruct a complete picture of where that entity has been in the system. Without it, a sequence of log messages from different commands can be impossible to connect.
Log the data that drives decisions
If a command branches based on a flag value, a query result or a configuration setting then log those values. In one diagnostic case at Audacia, an unexpected outcome in a client project came down to a third-party liability field in the data setup that had been overlooked. Logging the values involved in the branching condition made that visible. Without it, the team was working from the assumption that a code defect was to blame.
Write messages for engineers, not for end users
Log messages need to be specific, unique and descriptive enough for an engineer to locate the relevant code with a text search. If two exit points in the same command share the same message, it is impossible to determine which one fired. A unique, descriptive message - even a long one - is easier to work with than a tidy but ambiguous one.
What should be left out?
Sensitive data
Logs should not contain personal data unless there is a clear and justified reason. This is partly a compliance concern and partly a practical one: logging an entire object graph, or the full result set of a database query with navigation properties included, can surface data from related tables that was not anticipated. The principle is to log the minimum necessary to support diagnosis.
Project teams may have their own definitions of what counts as sensitive, which should be agreed with the client.
Over-logging
Log volume has real consequences. For example, a background function that generates high log output and runs frequently could cause any daily cap to be exceeded in a short span of time. Until this is noticed and remedied, logs will fail to reach the monitoring environment at all. This kind of gap is particularly problematic because it is silent - no error is surfaced, logs simply stop appearing.
Log levels exist to manage this. Informational is appropriate for general application events. Debug and Trace are intended for lower-level detail and may not be active in all environments or forwarded to the observability platform depending on configuration. Using the right level keeps ingestion costs predictable and ensures that information-level logs remain meaningful.
String interpolation vs. structured logging
Logging a message using string interpolation - embedding a value directly into the message text - produces a flat string. Most observability platforms can’t filter, facet or query that value as a property. Using a templated message with a named placeholder (e.g. "Found configuration for customer {CustomerId}") causes the logging framework to capture the value as a structured property, which observability platforms can then store and query on the log event. The difference becomes significant when filtering across large volumes of logs.
How to diagnose an issue using Azure App Insights
Knowing how to read logs is as important as knowing how to write them. Azure Application Insights provides several routes into the data; choosing the right one speeds up diagnosis considerably. Note that though Azure Application Insights is used as an example here, similar functionality is available in most observability platforms.
Use the operation ID to reconstruct a timeline
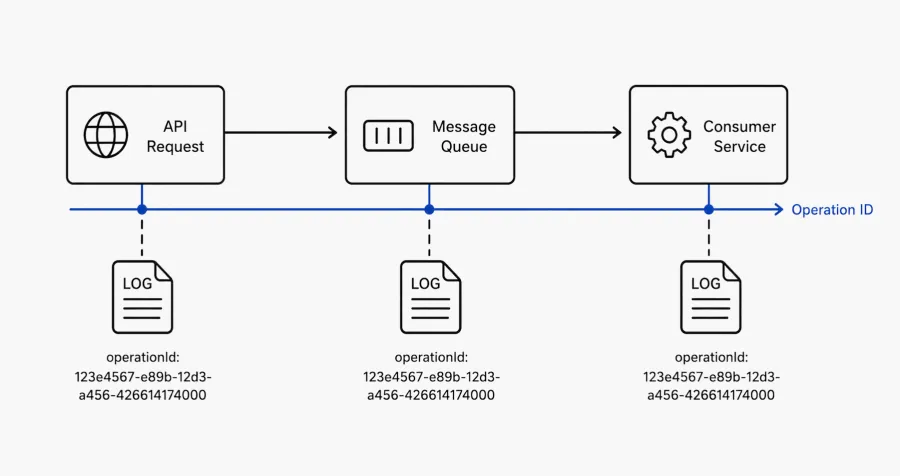
Every request or invocation in App Insights is associated with an operation ID - a correlation identifier that is automatically propagated across components if the system is configured correctly. Once an operation ID is found on any log entry, it can be used to query every trace, request and exception associated with that specific invocation.
This is particularly powerful for event-driven or multi-component architectures. If an API request triggers a message on a service bus, which is picked up by a separate component, the operation ID should carry through the entire chain - making it possible to follow a single logical operation across multiple services.
The operation ID is really just App Insights' implementation of a broader concept: the correlation ID. Different platforms use different names for the same idea - trace ID, request ID, correlation ID - but the principle holds everywhere: a single identifier generated once and passed through every downstream call, so a request can be traced across components without manual reconstruction. It's increasingly treated as a baseline expectation as architectures become more disconnected.
KQL: querying App Insights directly
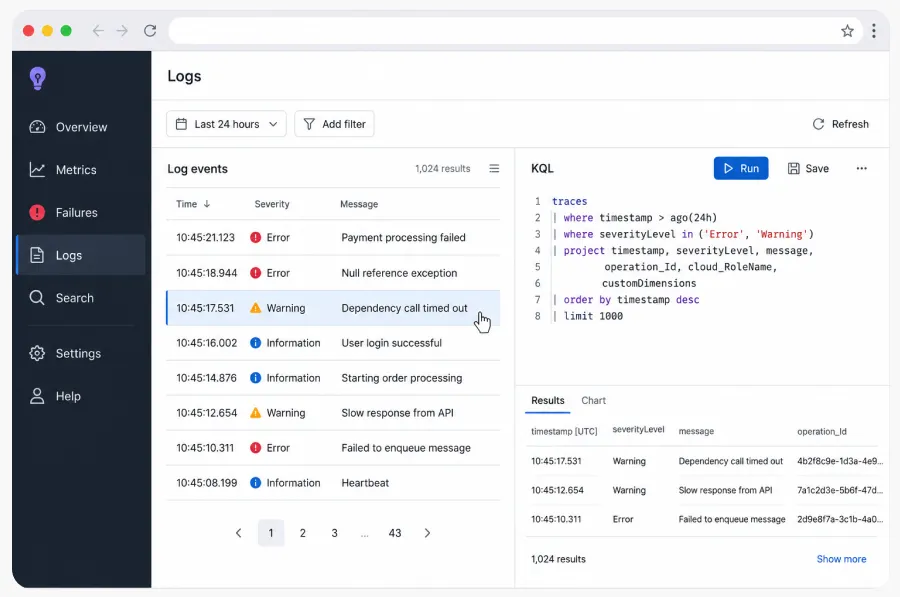
Illustration of Azure Application Insights log querying interface. Layout and query syntax are representative.
Azure App Insights supports Kusto Query Language (KQL), which is broadly similar to SQL in its approach. KQL queries run against entity type tables - traces, requests, exceptions, dependencies - and can be combined using unions to pull a complete picture of an operation.
For those unfamiliar with KQL, App Insights also provides a simple mode query builder that generates KQL from filter selections. Switching to KQL mode after building a query in simple mode is a practical way to learn the syntax incrementally.
Clicking into a result from Transaction search or Failures opens the end-to-end transaction details view, which provides a hierarchy and waterfall of all events associated with a request, including the duration of individual SQL calls and downstream dependencies. This is useful for understanding the order and relative timing of events, not just whether they succeeded.
Alerting: building on a foundation of good logs
Alerting is the next layer above logging, and its effectiveness depends directly on log quality.
Threshold-based alerting - triggering a notification when more than a certain number of exceptions occur within a short window - avoids noise from isolated domain exceptions while surfacing genuine system problems. The threshold needs to be calibrated to the application; some systems throw domain exceptions as part of normal operation, and alerting on every exception would produce constant false positives.
Absence-of-log alerting is a complementary pattern. If a background job is expected to run every five minutes and log a known entry message, an alert can be configured to fire if that message has not appeared within ten minutes. This catches failures that produce no exception.
Trend-based alerting goes further still: rather than responding to a threshold being crossed, it detects gradual degradation. A background job whose runtime is slowly increasing may not be failing, but it may be worth investigating before it does.
Alerting may also be relevant outside the development team. Depending on how a system is managed, a DevOps function or a client managing the service may need to be included in alert routing.
Audacia's approach to application logging
Audacia applies a consistent set of logging principles across its projects, adapted where necessary to meet project-specific requirements.
The core principles are:
- Use structured logging rather than string interpolation;
- include relevant data - entity identifiers, input values, branching conditions;
- make log messages descriptive and unique;
- use appropriate log levels to manage volume;
- mark significant points in a process including entry, exit, and decision points;
- and do not log sensitive data without clear justification.
Each rule addresses a real failure mode: unstructured logs that cannot be filtered, duplicate messages that cannot be located, sensitive data appearing where it should not or log volumes that exhaust ingestion limits and leave monitoring environments blind.
Conclusion
Good observability requires deliberate decisions about what to log, where to log it and how to structure it - made at the point of writing code, not in the middle of a production incident.
The investment is modest: an entry log, an exit log, a branching condition captured before the condition is evaluated, an entity ID included consistently throughout a process. Done well, those habits make production systems diagnosable without a debugger and give alerting a foundation worth building on.